

Report Reveals Market’s Pain In First Half Of 2022. Some Crypto Ecosystems Continue To Thrive
The first half of 2022 was painful for the crypto market. This is mainly because of the events during the second quarter, such as Terra’s collapse and Three Arrows Capital’s insolvency. A recent report produced by the popular crypto price-tracking site Coin Gecko has examined precisely what happened during this chaotic second quarter and how it could affect cryptocurrency in the remaining half of this year.
The following is some background about this report, summarizing what it says in simple terms and what it could mean for the crypto market going forward.
The report begins with a note from Coin Geckos founders where they talked about how crypto lost more than half of its market cap during Q2 and how this was due to a combination of macro factors and Terra’s collapse. The founders also mention Three Arrows Capital and how its insolvency took down crypto platforms exposed to it, like Voyager Digital, and noted the gradual decline in the NFT market.
On a more positive note, the founders point out that many crypto ecosystems continue to thrive, despite the bear market. They note that most of the leverage has been flushed out by the recent crashes and that many crypto companies and projects, including Coin Gecko, continue to operate as usual.
The Market Landscape
The first part of the report provides an overview of the crypto market. As mentioned in the report’s introduction, crypto lost nearly 56% of its market cap during the second quarter of this year and was 70% down from its November highs. Interestingly, trading volume during the second quarter was essentially the same as the first quarter, suggesting the same pool of traders and investors has stuck around since that time.
The authors then turn to the market dominance of the top 30 cryptocurrencies. Market dominance refers to how much of the total market cap comes from a single cryptocurrency. BTC’s dominance remains the same, while Ethereum fell significantly in June.
ETH’s decline may have something to do with the news that Ethereum developers had delayed Ethereum's “difficulty bomb,” which was interpreted by ETH investors as a sign that Ethereum’s merge to proof of stake was also delayed.
Another noteworthy thing in the report was that Bitfinex’s exchange token, Leo, was the only cryptocurrency that didn't end up in the red during the second quarter of this year. Some exchange tokens such as Binance have seen exponential growth, particularly in the last bull market.
Because of token utility and perks that exchanges can offer traders, and because they use trading fees to buy back and burn their native tokens, often causing their prices to rise artificially, they’re holding their own in the current bear market.
In the matter of the market cap of stablecoins, nearly $39 billion were lost as a result of Terra’s collapse. Tether’s USDT lost 20% of its market cap, with circle’s USDC picking up most of the slack. The report suggests that this is evidence that investors were cashing out of crypto completely during Q2.
The analysts found that the top 30 cryptocurrencies by market cap strongly correlate to the S&P 500 stock index, stating that the correlation was high at 0.92, which increased from 0.72 in Q1 of 2021. They highlight that crypto assets’ correlation with traditional markets is not surprising given the perceived risky nature and suggest that stocks were the primary drivers of crypto prices in Q2.
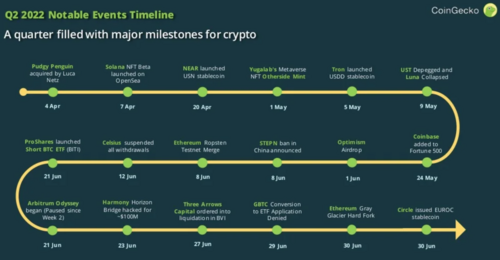
The authors provide an infographic of a timeline of the significant events in crypto during the second quarter of this year and include many important milestones for crypto. Such as Solana NFT launch, STEPN banned in China, Harmony Bridge hack, Grayscale’s ETF application denied by the SEC, Coinbase added to Fortune 500, and so on.
Bitcoin Analysis
The second part of the report provides an analysis of Bitcoin that shows how BTC briefly fell below its previous bull market top of 20K in June. It recorded nine consecutive weeks of being in the red. Notably, the broader equity market also fell at the same time, which dragged Bitcoin along with it.
Meanwhile, Bitcoin's hash rate only continues to climb and even managed to set an all-time high on June 8th of this year, despite the downward trend. For those who don't know, Bitcoin’s hash rate measures how much computing power is connected to the Bitcoin blockchain.
Bitcoin vs. Major Asset Classes
When comparing BTC to other major assets, the authors found that the only ones that saw any gains were oil and the US dollar. In comparison to the Q2 of 2021 return of oil at 22% and USD at -1% rose by 7% during Q2. The possible reasons are the current constricted oil supply and rising interest rates. It might also have something to do with the US dollar being backed by oil.
Interestingly, Bitcoin has simulated the behavior of US equities dipping in unison whenever the Federal Reserve announced a rate hike. The report states that the correlation between Bitcoin and other equities has been on an upward trend as the year progresses. Whether this trend will capitulate as we enter a recession has yet to be determined.
Ethereum Analysis
The third part of the report analyzes Ethereum and starts with an even scarier chart that shows how ETH fell by nearly 70% during Q2. The authors attribute this crash to Lido finance’s staked ETH token, notably its use in Terra’s now-defunct anchor protocol. Also, its use by alien crypto platforms like Celsius and its exposure to failed hedge funds, like Three Arrows Capital.
Next, the authors provide an updated timeline for Ethereum, transitioning from proof of work to proof of stake, which is already a bit outdated but puts the merge in Q3 this year, which is technically correct.
Interestingly, the authors found that the amount of ETH staked on Ethereum’s Beacon chain peaked at around 11% of ETH's total Supply. The authors also note that Lido Finance remains ETH's most significant single staker at over 32%. Then the authors show how much lido Finance’s staked ETH token deviated from its peg relative to ETH. But it's important to note that the peg was quickly restored after Ethereum developers confirmed a tentative date for the merge.
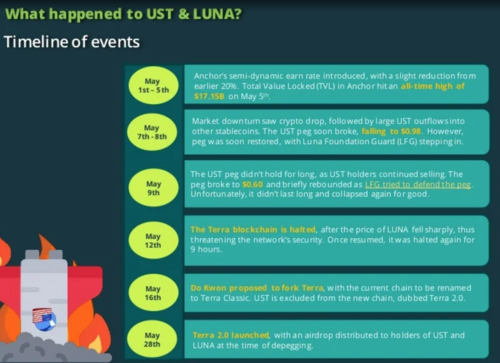
The Aftermath Of Terra’s Collapse
The fourth part of the report provides some perspective on Terra’s collapse. It starts with UST’s disastrous de-pegging from $1 to $0. It had a $1.8 billion market cap at its peak and fell to a mere $807 million at the end of June. The de-pegging event resulted in a 99% drop in value, with UST hitting lows of $0.007 since rebounding to $0.05.
The report referenced Jump Crypto, a crypto trading and VC firm heavily involved in the Terra ecosystem and rumored to have lost a lot of money defending UST’s peg.
The UST de-pegging had a domino effect causing LUNA’s painful implosion from $120 down to zero. The authors also note that LUNA’s supply increased by a whopping 1.9 million% before Terra’s validators turned off the mint and burn mechanism.
The report shows a detailed timeline of Terra’s collapse, but interestingly, it doesn’t mention the alleged attack on the 4pool on Curve Finance that occurred after the Terra team withdrew UST liquidity, the exact timing of which was not publicly known.
Investigations by on-chain analytics platforms such as Chain Analysis suggest that this alleged attack caused UST's initial de-pegging. This is something that each subsequent investigation found was exacerbated by Celsius withdrawing massive amounts of UST from the Anchor Protocol out of caution.
The authors of this crypto report seem to blame Terra’s collapse on the broader crypto market conditions, which also played a role.
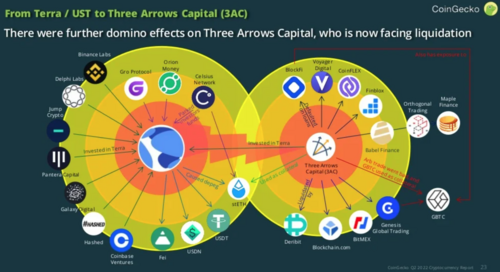
More Domino Effects
The report displays an excellent infographic about the second-order effects of Terra’s collapse. On the left side, you have all the institutions which invested in Terra, including Jump Crypto. On the top left are the crypto projects and platforms exposed to Terra, such as Celsius. And on the bottom left are all the different stablecoins that were de-pegged.
The right side shows Three Arrows Capital which was, of course, exposed to Terra, and on the top are all the different crypto projects and platforms exposed to 3AC. On the bottom right, you have all the crypto companies exposed to 3AC. The authors then provide more details about how Celsius, BlockFi, and Voyager Digital were affected by Terra's collapse and 3AC’s insolvency.
Defi Analysis
The fifth part of the report analyzes the decentralized finance ecosystem. It starts with another unsurprising chart showing how the total Defi market cap fell by nearly 75% during the second quarter of this year, a crash mainly caused by Terra’s collapse.
However, they don’t state which cryptos they count as part of their Defi market cap measure, but the silver lining to this gloomy statistic is that Defi managed to retain most of its users, with a decline of only a third. It stated there were multiple instances in Q2 where the need for Defi truly shined.
What's fascinating is that the authors found that users flocked to decentralized exchanges when centralized exchanges were having issues with LUNA and UST. And users flocked to Defi protocols after Celsius paused withdrawals. In both events, where centralized entities failed, users have converged to enjoy Defi’s permissionless nature.
They then reveal the different Defi categories, their share of the Defi market, and how much they dropped during Q2. Unfortunately, the authors don't provide specifics about individual Defi projects. The main takeaway seems to be that DEX's are the most significant slice of the Defi pie at 44%.
Non-Fungible Tokens (NFTs) Analysis
The sixth part of the report provides an analysis of the NFT ecosystem, and it starts by shedding the spotlight on the massive decline in NFT trading volume since the start of the year.
The authors note that Solana, the latest contender to challenge Ethereum for the NFT crown, and BNB are becoming popular NFT chains because of STEPN; however, China’s ban on STEPN may put a dent into BNB’s numbers.
The authors found that even though OpenSea is still the biggest NFT marketplace by trading volume, its dominance is declining due to new competitors like Magic Eden, an NFT marketplace on Solana.
Some would argue that OpenSea’s decline is less due to competition and more due to the platform's controversial actions, such as freezing NFTs and blocking users in sanctioned countries.
Regarding NFT trends, the authors believe that NFT investors are moving away from move-to-earn and silly NFTs with no utility and moving towards NFT profile pictures and NFTs that are actual art like those found on art blocks.
This part of the report concludes by focusing on Solana's NFT ecosystem stating that OpenSea and Magic Eden have forged a gateway into the Solana ecosystem. They noted that despite the NFT market’s decline due to bearish macroeconomic conditions, Solana has been chipping away at Ethereum’s NFT Market share.
Crypto Exchanges In A Sweet Spot
The seventh part of the report provides an analysis of cryptocurrency exchanges. It starts with a surprising statistic: trading volumes on centralized and decentralized exchanges only fell by 11% during Q2. The authors note that centralized exchanges are beginning to increase their dominance despite all the risks associated with centralized crypto platforms.
This could be because traders and investors are using centralized exchanges to cash out. Alternatively, this increase in dominance could be coming from the fact that some exchanges like Binance recently slashed trading fees, which would explain why Binance's dominance increased significantly during Q2.
FTX's dominance also doubled during this period, but the authors note that “no one can compete with Binance as they have grown their market share to capture almost 50% of the entire market.”
By contrast, OKX and Crypto.com’s dominance decreased by 50% each. The authors note that Uniswap dominates the DEX market accounting for 60% of total DEX trading volume. They also note that Curve Finance’s trading volume increased significantly during Q2, likely due to both collapsed USTC pools and the flight to stablecoins. Curve Finance is a stablecoin DEX.
Also, DEXs on Solana and BNB have increased or maintained their market share, signifying actual market activity on chains other than Ethereum.
Traders’ Shy Away From Speculation
The authors examine derivatives such as Futures Trading, which involves speculating on the future price of a particular coin or token, often with leverage, in other words, debt. They look at funding rates which is how much money traders put down to cover their long or short positions.
Interestingly, they note that crypto's recent choppy price action has put traders off from speculation, leading to more conservative stances on Bitcoin's direction, which is good news for crypto market volatility.
The authors end the report by examining the assets under management for Grayscale’s Bitcoin Trust and the Proshares Bitcoin Futures ETF, which was approved in October last year.
The authors note that the assets under management for both institutional investment vehicles collapsed by more than 50% alongside BTC’s price, which isn't surprising. They also note that the GBTC discount fell below 30% after the SEC rejected Grayscale’s Spot Bitcoin ETF application.
What Does This Mean For Crypto?
So the big question is, what do the findings of this report mean for the crypto market? If cryptos' current price action didn't make it clear enough, the massive purge we saw in Q2 has set the stage for a severe recovery rally, which we’re in, arguably.
However, it's only a matter of time before the markets realize that all the macro factors which caused the recent crypto crashes haven't been resolved, and this could take crypto to new lows.
You could argue that crypto hasn't seen peak capitulation, not just because many institutional investors like Kevin O'Leary believe that we haven't seen total panic yet. The millionaire investor says, “crypto markets need to hit total panic before revival.”
O'Leary thinks that the market bottom will be marked by “total panic,” at which point weak companies with “idiot managers” will be weeded out, and the industry can continue to grow. He added,
“It’s unfortunate that these companies have gone to zero, but you end up with much stronger species.”
It’s also indicated in the report that although crypto prices have taken a beating, the number of daily defi users has remained relatively stable by comparison. Also, trading volumes have barely budged, and Bitcoin’s hash rate continued to climb even while BTC’s price crashed.
If what we saw over the last half year had indeed been the market bottom, then it stands to reason that all these metrics would have fallen by much more. For example, the Bitcoin hash rate fell by nearly 50% in previous bear markets but was only 10% off the most recent hash rate highs.
Not only that, but consider that only two entities exposed to Terra and Three Arrows Capital have collapsed. As the infographic shows, there were nearly two dozen exposed entities, and we're still getting news about some of these running into serious trouble. And that’s apart from all the cryptos that 3AC could soon sell.
If you're wondering when the current recovery rally could end, some posit mid to late September, when Ethereum’s merge is expected to occur. It’s also when the Federal Reserve will return from its summer holiday with what's likely to be a fresh rate hike to fight inflation.
Cointelegraph points out that the current ETH rally could be a bull trap with the macroeconomic clouds darkening. A bull trap indicates that a declining trend in a crypto asset has reversed and is heading upward when it will actually continue downward.
With Autumn nearing in many parts of the world, people could start to face skyrocketing energy costs in anticipation of oil and gas shortages over the winter, something that would almost certainly damage assets across the board, such as oil, gas, and the US dollar.
It’s still risky days ahead given the macroeconomic factors at play, so hang on to your hats and brave the storm. As the saying goes, “No pain, No gain.” The one constant is change, and I believe all these factors are contributing to a more robust, healthier cryptocurrency industry where genuine projects and communities will flourish.
(4).gif)

This information is provided for informational purposes only. Nothing herein shall be construed as financial, legal, or tax advice.
Bruce Jacobs